Imagine spending hundreds of thousands of dollars on state-of-the-art laboratory equipment, hiring top-tier scientific talent, and collecting vital biological samples only for the final results to sit completely untouched on an isolated hard drive.
This is the exact reality facing local research centers, university departments, and hospital labs across London and the Gulf region.
Massive national investments like the Saudi Genome Program, the Emirati Genome Program, and large-scale genetic bio-banks in Qatar and the UK have successfully democratized DNA and RNA sequencing. Getting a machine to read genetic material has become fast and highly accessible. Yet, regional facilities are running into a massive, hidden wall: the bioinformatics bottleneck. They can generate raw files effortlessly, but they lack the highly specialized expertise required to transform sequencing output into actionable insights through advanced RNA-Seq data analysis and interpretation.
The Core Pain Point: Brilliant Biologists vs. Cryptic Code
The main issue is a direct mismatch in technical skills.
A standard regional clinical or university lab is operated by exceptional molecular biologists, pathologists, and technicians. They are experts at handling physical patient tissue, extracting RNA, and running complex sequencing machinery.
However, the moment the sequencing machine finishes its run, it spits out millions of lines of text-based raw data (known as FASTQ files). Translating these raw files into a readable chart of active or inactive genes requires a multi-step computational pipeline and specialized bulk RNA seq analysis workflows.
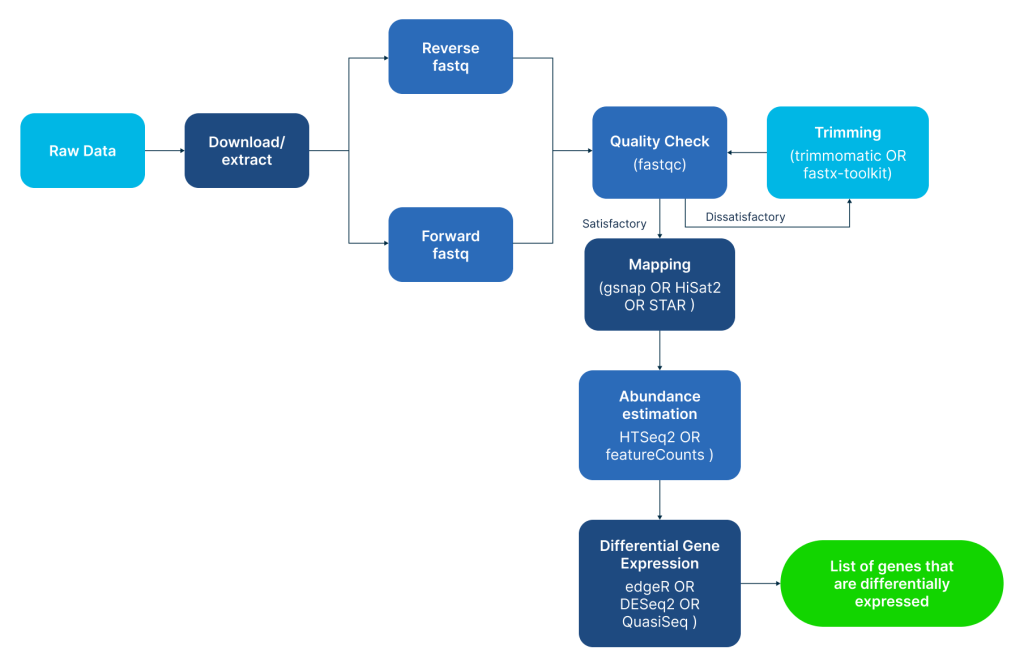
Processing raw sequencing reads involves navigating a highly complex software stack. A researcher cannot simply open these files on a regular computer; they must know how to code in languages like Python or R, execute complex commands in a Linux server environment, and manually handle data cleaning (Trimming), alignment (Mapping), and gene estimation.
Because dedicated bioinformaticians (scientists who specialize in coding for genetics) are in extremely high demand globally, smaller regional labs in cities like London, Riyadh, Doha, or Dubai often have to wait months for a specialist to look at their files. Consequently, priceless data sits completely unmined in localized storage silos instead of contributing to meaningful genome analysis and biomedical discoveries.
Why Gulf and UK Labs Face Unique Data Challenges
While the bioinformatics shortage is a global issue, facilities across the UK and the Gulf Cooperation Council (GCC) face distinct regulatory and operational challenges that complicate standard RNA-Seq data analysis projects.
Strict Data Sovereignty Laws
In countries like Saudi Arabia, the UAE, and Qatar, national health regulations strictly dictate that patient genetic data cannot leave domestic borders. This means local researchers cannot simply upload their massive raw datasets to popular, international public cloud services or send them to third-party analysis companies abroad. They are forced to manage heavy computational pipelines on local, isolated, and often underpowered server nodes.
Infrastructure Overhead and Software Fatigue
Maintaining the high-performance computing (HPC) setups required for alignment algorithms consumes massive amounts of RAM and technical bandwidth. Without an internal IT team dedicated solely to genomics, tools break, software updates clash, and local processing pipelines stall out entirely.
The Risk of Shallow Analysis
When smaller laboratories attempt to bypass this coding bottleneck using simple, automated default scripts, they often get flawed results. Without expert quality control, data normalization, and filtration of technical artifacts, the resulting biological conclusions can easily be skewed—leading to wasted resources or dead-end research.
The Wasted Potential of Unanalyzed Data
Leaving transcriptomic data unmined does more than just delay research publications; it carries a steep operational and financial cost:
- Missed Precision Medicine Discoveries: Crucial biological signals such as rare novel biomarkers, low-abundance transcript variations, or complex gene mutations linked to regional health challenges go completely unnoticed.
- Sunk Capital: High-quality biological samples, expensive library preparation kits, and chemical reagents represent an enormous financial investment that yields zero return when data sits idle.
- Fragmented Standards: When different regional hubs use disconnected, non-standardized methods to patch together basic analyses, it becomes impossible to safely merge or compare datasets across multiple population health studies.
Breaking the Bottleneck: Moving from Bytes to Biology with GenomeBeans
To stop raw data from piling up on laboratory hard drives, the life sciences sector needs to shift its focus away from raw sequencing speed and toward automated, secure analysis platforms.
This is where GenomeBeans completely transforms the workflow.
Engineered specifically as an all-in-one, web-based Next-Generation Sequencing (NGS) Analysis Platform, GenomeBeans allows laboratory scientists to process and interpret raw sequencing data without needing a single line of code or prior command-line experience. By handling the heavy computational lifting automatically, GenomeBeans provides an accelerated, intuitive path from raw FASTQ files straight to publication-ready figures.
Why Regional Laboratories Choose GenomeBeans:
- Completely Code-Free Analysis: Upload your raw sequencing files, choose your parameters via a clear visual dashboard, and let automated, industry-standard pipelines handle the rest.
- Absolute Compliance and Security: Designed with data privacy at its core, GenomeBeans offers secure data management and a guaranteed 90-day data archival facility, ensuring your data remains completely under your local ownership.
- Rapid Turnaround: Instead of waiting weeks or months for an available bioinformatics specialist, your lab can generate fully interpreted figures, pathways, and customized charts in a matter of hours.
When local and regional labs are empowered with accessible, robust analytical workflows, raw sequencing files stop being an overwhelming storage burden. Instead, they become exactly what they were meant to be: a streamlined launchpad for the next generation of precision medicine and biomedical breakthroughs.
Optimize Your Transcriptomic Workflows
Don’t let your valuable transcriptomic data sit unanalyzed in storage silos. Streamline your entire bulk RNA seq analysis workflow, eliminate computational bottlenecks, and discover how expert RNA-Seq data analysis can accelerate research outcomes and biological discovery.