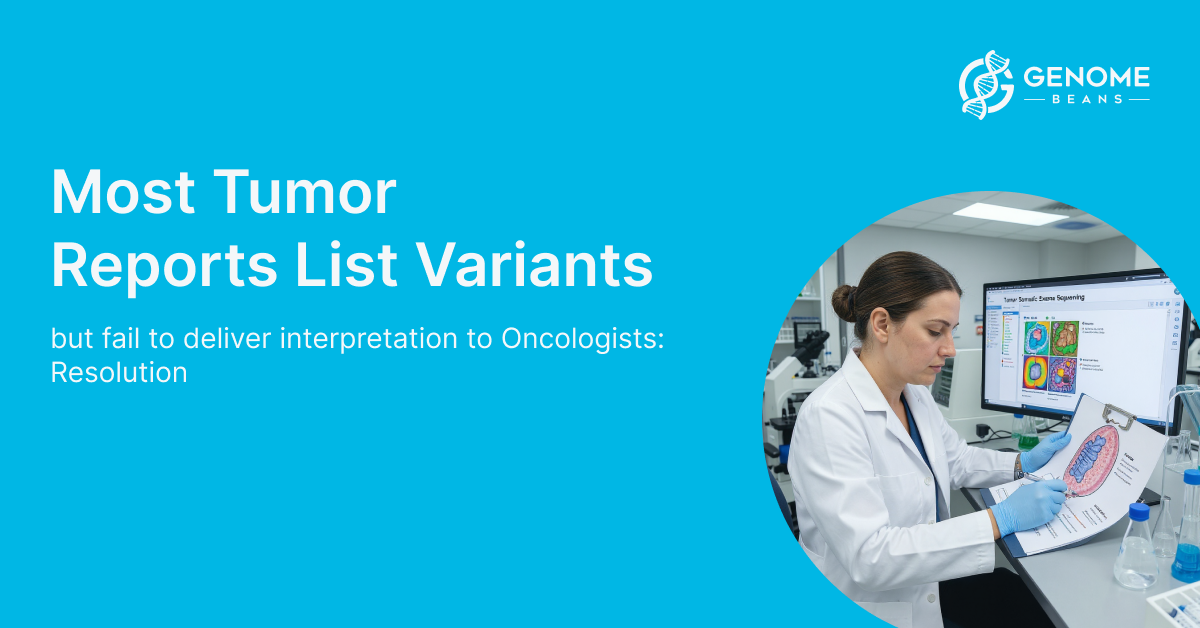
Every day, oncologists receive tumor sequencing reports packed with variant lists, EGFR mutations, KRAS alterations, TMB (Tumor Mutational Burden) scores, but too often, those reports stop there. The data arrives without context, without clinical translation, and without a clear path forward. Which mutation is actually driving the tumor? Which therapy is relevant for this patient? The gap between genomic data and clinical decision-making isn’t a data problem; it’s an interpretation problem. And it’s one precision oncology can no longer afford to leave unsolved.
You just spent three weeks running tumor somatic exome sequencing. The runs are finished, the raw data is on your drive, and your lab director wants the final analysis by Friday.
You open the variant report expecting a clear roadmap for your targeted therapy pipeline. Instead, you face an unfiltered variant output.
A 40-page spreadsheet packed with genomic coordinates, multiple transcript identifiers, and cryptic single nucleotide variations. Zero clinical context. No clear path forward. Just rows of unannotated data that leave you asking: “What do we actually do with this?”
This is the hidden bottleneck in precision oncology. Most platforms excel at identifying genetic variations but leave researchers stranded when it comes to translating those variants into meaningful biological insights or actionable clinical targets.
Here is how modern genomics labs are bridging the gap between raw sequencing files and actionable discovery without manual pipeline configuration at every step.
What Tumor Somatic Exome Sequencing Actually Reveals
Tumor somatic exome sequencing targets the protein-coding regions of the cancer genome, where a high proportion of characterized driver mutations occur. By sequencing tumor tissue alongside a matched normal sample, the workflow filters out baseline germline variants, isolating the specific acquired mutations that alter cellular behavior. It is worth noting that some clinically relevant alterations, including splice-site variants and certain structural rearrangements, may fall outside the exome, which is an inherent scope consideration when choosing between WES, targeted panels, and WGS.
This analysis identifies three primary classes of somatic alterations:
Single Nucleotide Variants (SNVs)
Single-base changes that can render a crucial protein constitutively active or entirely non-functional.
Insertions and Deletions (Indels)
Frameshifting indels disrupt the open reading frame and alter downstream protein translation. In-frame indels, by contrast, insert or delete whole codons without frameshift, often with distinct functional consequences.
Copy Number Variations (CNVs)
Large-scale genomic duplications or deletions that drive aberrant gene expression levels.
Identifying a variation, however, is only the first step. The true challenge lies in determining whether a variant actively drives oncogenesis or is a passenger mutation with no functional consequence.
The Bioinformatics Grind: Filtering, Alignment, and Classification
Processing raw sequencing data requires substantial computational work before the biology becomes interpretable. Raw reads first undergo quality assessment and trimming using tools such as FastQC and Trimmomatic before alignment algorithms map them back to a human reference genome. Once aligned, variant callers evaluate every position to detect where the tumor sample diverges from the matched normal.
The operational bottleneck occurs during variant annotation. This stage links raw genomic coordinates to specialized knowledge bases:
- COSMIC for catalogued somatic mutations across cancer types
- OncoKB and CIViC for evidence-based therapeutic and clinical significance
- gnomAD for population allele frequencies that help filter likely benign variants
A standard analytical pipeline follows a strict progression:
Raw FASTQ Files → QC & Trimming → Alignment → Variant Calling → Annotation & AMP Classification
At each stage, the software must answer critical questions:
- Has this mutation been verified in other patient cohorts?
- Does the amino acid substitution alter a functional protein domain?
- Is this a common population variant that can be deprioritized?
Finally, variants are classified according to AMP/ASCO/CAP guidelines: a four-tier framework separating Tier I mutations (strong clinical significance) through Tier IV (benign or likely benign alterations). Manually cross-referencing thousands of variants against this framework is a reliable path to lab burnout.
From Variants to Actionable Therapy Targets
The primary breakdown in cancer genomics is the failure to turn an annotated variant list into a useful research or clinical direction. Pharma R&D teams and oncology researchers do not just need to know that a gene is mutated; they need to know whether that mutation creates a druggable target or signals resistance to an existing compound.
True actionability means connecting genomic data directly to functional outcomes:
Targeted Molecule Matching
Linking a verified driver mutation to an existing small-molecule inhibitor or monoclonal antibody with supporting clinical evidence.
Clinical Trial Stratification
Sorting sample cohorts based on precise molecular profiles for biomarker-driven trial enrollment or target validation studies.
Resistance Biomarker Identification
Flagging secondary mutations that drive resistance to standard therapies, preventing dead-end research directions before they consume resources.
When a pipeline lacks an integrated interpretation layer, sequencing data remains an expensive, uninterpretable output. Researchers end up spending hours manually cross-referencing literature that the platform should have surfaced automatically.
How GenomeBeans Structures the Tumor Somatic Exome Report
GenomeBeans was built to solve this interpretation gap. The automated bioinformatics platform manages the entire pipeline, from raw FASTQ files to clinical tiering, and produces a structured Tumor Somatic Exome report designed for immediate clinical and research use.
Findings are prioritized using a clinically aligned hierarchical structure based on AMP/ASCO/CAP guidelines:
TIER I: Actionable Targets
Variants with strong, direct therapeutic associations and established clinical evidence.
TIER II: Emerging Clinical Relevance
Active trial matches, investigational targets, and relevant sub-clonal markers with accumulating evidence.
TIER III: Variants of Unknown Significance
VUS requiring further functional validation before clinical application.
TIER IV: Benign and Likely Benign
Variants deprioritized based on population frequency and functional evidence.
The cloud platform automates alignment, quality control, and variant calling using standardized, reproducible pipelines with full version control. The final report surfaces verified somatic mutations alongside their therapeutic implications, structured for review, not for further processing. The emphasis is on reproducibility and auditability across research and clinical workflows.
Review a Structured, Actionable Layout
Click below to download a production-grade sample report and see how GenomeBeans organizes complex variant data into clear, interpretable findings:
Download Sample Tumor Exome Report
Stop spending research hours formatting spreadsheets and manually cross-referencing public databases. Upload your raw sequencing files to GenomeBeans, run your somatic exome pipelines automatically, and get structured biological insights your team can act on within hours.