Category: Life Sciences & Biotechnology

  • Choosing the Right Bioinformatics Platform: Infrastructure, Architecture, and Real Cost Breakdown

    Choosing the Right Bioinformatics Platform: Infrastructure, Architecture, and Real Cost Breakdown

    Finalizing a bioinformatics platform for your lab requires looking past marketing buzzwords and analyzing the cold, hard numbers of data infrastructure. One oversight and you face sudden cloud compute invoices, massive upfront license expenses, or hidden maintenance overheads that drain your laboratory’s grant.

    To choose the right digital architecture for your genomic data, you must evaluate three core pillars: infrastructure footprint, billing model, and the technical capacity your team can realistically support.

    Note: GenomeBeans is included in this comparison as one of several active platforms in this space. We’ve aimed to apply the same scrutiny to our own model as to the others below.

    Architectural & Financial Blueprint Matrix

    Platform Deployment Architecture Billing Model Real-World Financial Impact
    Galaxy Public Academic Cloud / Shared Servers $0 (Free) Zero software cost; indirect cost is time spent waiting in public compute queues.
    GenomeBeans Secure Cloud Pipeline Platform Per-Experiment / Checkout Model Predictable cost per sample/run; best suited to project-based volumes rather than continuous high-throughput operations.
    Qiagen CLC On-Premise Workstation / Desktop App Fixed Annual Subscription (Per-seat license) High upfront cost; requires in-house IT support for hardware upkeep, though cost-effective for sustained high-volume local processing.
    DNAStar Lasergene On-Premise Workstation / Desktop App Fixed Annual Subscription (Academic/Commercial tiers) Predictable yearly budgeting; includes updates and support, but performance is capped by local hardware.
    Illumina ICA Cloud-Native Environment (AWS/Azure) Consumption-Based iCredits (Per-Gigabase / Per-Hour) Highly scalable; variable monthly billing tied to compute and storage use, requiring active monitoring.
    BIOVIA Enterprise Life Sciences Hybrid Cloud Custom Enterprise Contracts (Multi-year agreements) High-end capital expenditure tailored to pharmaceutical PLM scaling.

    Deep Dive: How the Cost Models Actually Work

    1. The Consumption-Based Cloud: Illumina ICA

    Illumina Connected Analytics (ICA) is built for high-throughput core facilities processing data directly from the sequencer. It runs on iCredits you pay for compute hours (by node size) and storage (per TB/month). DRAGEN pipelines like Map & Align apply volumetric tier pricing per gigabase, meaning your monthly spend scales directly with sequencing output. This is efficient at scale but requires active budget monitoring, since costs are variable rather than fixed.

    2. The Fixed-License Desktop Suites: Qiagen CLC & DNAStar Lasergene

    For labs that prefer capped annual costs, desktop installations isolate financial risk. Qiagen CLC Genomics Workbench charges a flat per-seat annual fee regardless of sample volume good for predictability, but the upfront cost is real, and hardware maintenance falls on your own IT resources. DNAStar Lasergene follows a similar model with academic discounts; because processing is local, you avoid cloud fees, but you’re bound by your workstation’s own RAM and CPU limits.

    3. The Checkout-Driven Automation: GenomeBeans

    For research teams and biotech setups that want to avoid the upfront cost of desktop licenses or the variable complexity of full cloud infrastructure, GenomeBeans uses a per-experiment checkout model: upload FASTQ data, set parameters, and pay per analysis run. This gives predictable, project-based cost without hardware overhead. It suits teams with project-based or fluctuating sample volumes particularly well; teams running continuous, very high sample throughput should model per-experiment costs against a subscription or on-prem alternative to see which scales more economically at their specific volume.

    4. The Zero-Cost Utility: Galaxy

    Galaxy is the baseline of open-source genomics access functionally free, letting students and resource-constrained labs run standard RNA-Seq analysis or alignment tools on shared public infrastructure. The tradeoff is processing latency: jobs queue behind global academic demand, which can be a real constraint for time-sensitive clinical or commercial work.

    Regional Infrastructure Realities

    Compliance-heavy environments (needing HIPAA, GxP, or strict data residency) often justify the variable cost of cloud platforms like Illumina ICA or the fixed licensing of Qiagen CLC, since validated, auditable pipelines matter more than minimizing per-sample cost. In markets more focused on cost-to-performance efficiency and avoiding idle capital expenditure, on-demand models whether GenomeBeans’ checkout structure or Galaxy for training and low-volume work tended to reduce the burden of maintaining underused local infrastructure.

    The Verdict: Which One Should You Deploy?

    Ask yourself: who is running the data, and how do you want to pay for compute?

    • Galaxy suits students, low-volume pilot studies, or teams with a $0 software budget where processing delays don’t affect timelines.
    • GenomeBeans suits teams wanting commercial-grade pipelines without hardware or maintenance overhead, particularly for project-based or variable sample volumes worth benchmarking against a subscription model if your throughput is consistently high.
    • Qiagen CLC or DNAStar suit well-funded, independent labs that want direct local control over data processing and can absorb upfront licensing costs.
    • Illumina ICA or BIOVIA suit enterprise-scale, high-throughput operations with an engineering team able to manage variable cloud costs and deep automation needs.
  • Same Diagnosis, Different Outcomes: How DNA Sequencing Is Changing Cancer Treatment

    Same Diagnosis, Different Outcomes: How DNA Sequencing Is Changing Cancer Treatment

    Imagine two patients diagnosed with the same lung cancer. Same stage, same diagnosis. One responds well to treatment. The other doesn’t, and for decades, doctors had no way of knowing why until it was too late.

    For the longest time, cancer treatment worked like a blunt instrument: surgery, chemotherapy, radiation, applied broadly and hoped for the best. That’s changing, because scientists learned to read the instruction manual hidden inside every tumor.

    Why Cancer Is Really a Disease of DNA

    Cancer doesn’t start in an organ; it originates in a single cell whose DNA has mutated. DNA acts as an instruction manual for a cell’s day to day processes. This manual consists of a sequence of letters A, T, G and C (representing nucleotide bases, Adenine, Thymine, Guanine and Cytosine). The arrangement of this sequence and the chapters a cell chooses to read are unique to each individual.

    A cell multiplies by dividing! When small errors (like skipping, misplacement or adding one of those letters) occur randomly during re-printing that manual while making a new cell from an old one, it leads to what we call “mutations.” On unfortunate rare occasions, when this error occurs in the “cell division” chapter and escapes our immunity’s surveillance, the next read of this chapter can lead to uncontrollable new cells. These aren’t healthy, functioning cells, but they are programmed to divide and consume healthy neighbouring cells’ resources, thus causing cancers.

    So, two tumors can share the same diagnosis and still be driven by entirely different mutations. That difference is exactly what decides whether a treatment will work.

    What DNA Sequencing Actually Does

    Reading a person’s whole DNA (or genome) once took decades and billions of dollars. The Human Genome Project, took thirteen years for single human genome. Today, Next-Generation Sequencing technology (NGS) can do the same job in hours, at a fraction of the cost through modern bioinformatics services.

    NGS is used to read the DNA sequence in tumor cells and compare it against the patient’s own healthy DNA. The mutations unique to cancer cells’ DNA form a molecular fingerprint that reveals what’s actually driving the tumor’s growth.

    Matching the Fingerprint to Treatment

    Once doctors know a tumor’s key mutations, they can select therapies designed for those exact changes, called targeted therapies.

    For example, DNA (say, manual) of some breast cancer patients carries a mutation (here, extra copy) of a gene (say, chapter) called HER2. These patients respond well to trastuzumab drugs (like Herceptin), which blocks the protein product of the HER2 gene directly. Patients without this mutation face the drug’s side effects with no improvement in health.

    Sequencing supports Immunotherapy – treatment that activates a patient’s own immune system against cancer. One measure, tumor mutational burden (TMB), simply counts how many mutations a tumor carries; tumours with more mutations tend to look more like a “suspect” to the immune system, making them more likely to respond to drugs called “checkpoint inhibitors.”

    “Microsatellite instability, a marker (say, red flag) in tumor DNA, helped identify patients suited to a drug called pembrolizumab. This drug was approved in 2017 across multiple cancer types based on this shared feature, regardless of where the cancer started.

    Does Every Patient Benefit?

    Not always. Sequencing is valuable when it finds a mutation with a matched, evidence-backed therapy. For certain types of cancers like breast, lung, and colorectal, this is becoming a standard practice. Sadly, for others, options remain limited, and results may mainly guide eligibility for somatic variant calling and clinical research.

    Access matters too. Comprehensive sequencing isn’t available everywhere; interpreting results requires specialist expertise; and cost and infrastructure remain barriers to efficient patient care.

    What’s Coming Next

    Liquid biopsy detects tumor DNA in a blood sample. This method might allow earlier detection and easier treatment monitoring without repeated tissue biopsies.

    Machine learning is helping researchers interpret genomic data faster, spotting patterns across thousands of profiles.

    Multi-omics approaches are beginning to combine DNA with RNA, protein, and other data for a fuller picture of tumor biology.

    Even with promising technology, cancer remains a formidable challenge, resisting and evolving. But understanding cancer at the molecular level is steadily reshaping prevention, treatment, and patients’ quality of life.

    Key Takeaways

    • Cancer is a disease of DNA mutations – even tumours with the same name can be driven by very different changes.
    • Sequencing a tumor’s DNA reveals which mutations are driving it, helping doctors match patients to therapies most likely to work.
    • Targeted therapies and immunotherapy selection both depend on genomic markers found through sequencing.
    • Sequencing is most useful when it finds an actionable mutation – results aren’t always immediately useful for every patient.
    • Liquid biopsy, AI-assisted analysis, and multi-omics are expanding what’s possible next.
  • Most Tumor Reports List Variants but Fail to Deliver Interpretation to Oncologists. Here Is the Fix.

    Most Tumor Reports List Variants but Fail to Deliver Interpretation to Oncologists. Here Is the Fix.

    Every day, oncologists receive tumor sequencing reports packed with variant lists, EGFR mutations, KRAS alterations, TMB (Tumor Mutational Burden) scores, but too often, those reports stop there. The data arrives without context, without clinical translation, and without a clear path forward. Which mutation is actually driving the tumor? Which therapy is relevant for this patient? The gap between genomic data and clinical decision-making isn’t a data problem; it’s an interpretation problem. And it’s one precision oncology can no longer afford to leave unsolved.

    You just spent three weeks running tumor somatic exome sequencing. The runs are finished, the raw data is on your drive, and your lab director wants the final analysis by Friday.

    You open the variant report expecting a clear roadmap for your targeted therapy pipeline. Instead, you face an unfiltered variant output.

    A 40-page spreadsheet packed with genomic coordinates, multiple transcript identifiers, and cryptic single nucleotide variations. Zero clinical context. No clear path forward. Just rows of unannotated data that leave you asking: “What do we actually do with this?”

    This is the hidden bottleneck in precision oncology. Most platforms excel at identifying genetic variations but leave researchers stranded when it comes to translating those variants into meaningful biological insights or actionable clinical targets.

    Here is how modern genomics labs are bridging the gap between raw sequencing files and actionable discovery without manual pipeline configuration at every step.

    What Tumor Somatic Exome Sequencing Actually Reveals

    Tumor somatic exome sequencing targets the protein-coding regions of the cancer genome, where a high proportion of characterized driver mutations occur. By sequencing tumor tissue alongside a matched normal sample, the workflow filters out baseline germline variants, isolating the specific acquired mutations that alter cellular behavior. It is worth noting that some clinically relevant alterations, including splice-site variants and certain structural rearrangements, may fall outside the exome, which is an inherent scope consideration when choosing between WES, targeted panels, and WGS.

    This analysis identifies three primary classes of somatic alterations:

    Single Nucleotide Variants (SNVs)

    Single-base changes that can render a crucial protein constitutively active or entirely non-functional.

    Insertions and Deletions (Indels)

    Frameshifting indels disrupt the open reading frame and alter downstream protein translation. In-frame indels, by contrast, insert or delete whole codons without frameshift, often with distinct functional consequences.

    Copy Number Variations (CNVs)

    Large-scale genomic duplications or deletions that drive aberrant gene expression levels.

    Identifying a variation, however, is only the first step. The true challenge lies in determining whether a variant actively drives oncogenesis or is a passenger mutation with no functional consequence.

    The Bioinformatics Grind: Filtering, Alignment, and Classification

    Processing raw sequencing data requires substantial computational work before the biology becomes interpretable. Raw reads first undergo quality assessment and trimming using tools such as FastQC and Trimmomatic before alignment algorithms map them back to a human reference genome. Once aligned, variant callers evaluate every position to detect where the tumor sample diverges from the matched normal.

    The operational bottleneck occurs during variant annotation. This stage links raw genomic coordinates to specialized knowledge bases:

    • COSMIC for catalogued somatic mutations across cancer types
    • OncoKB and CIViC for evidence-based therapeutic and clinical significance
    • gnomAD for population allele frequencies that help filter likely benign variants

    A standard analytical pipeline follows a strict progression:

    Raw FASTQ Files → QC & Trimming → Alignment → Variant Calling → Annotation & AMP Classification

    At each stage, the software must answer critical questions:

    • Has this mutation been verified in other patient cohorts?
    • Does the amino acid substitution alter a functional protein domain?
    • Is this a common population variant that can be deprioritized?

    Finally, variants are classified according to AMP/ASCO/CAP guidelines: a four-tier framework separating Tier I mutations (strong clinical significance) through Tier IV (benign or likely benign alterations). Manually cross-referencing thousands of variants against this framework is a reliable path to lab burnout.

    From Variants to Actionable Therapy Targets

    The primary breakdown in cancer genomics is the failure to turn an annotated variant list into a useful research or clinical direction. Pharma R&D teams and oncology researchers do not just need to know that a gene is mutated; they need to know whether that mutation creates a druggable target or signals resistance to an existing compound.

    True actionability means connecting genomic data directly to functional outcomes:

    Targeted Molecule Matching

    Linking a verified driver mutation to an existing small-molecule inhibitor or monoclonal antibody with supporting clinical evidence.

    Clinical Trial Stratification

    Sorting sample cohorts based on precise molecular profiles for biomarker-driven trial enrollment or target validation studies.

    Resistance Biomarker Identification

    Flagging secondary mutations that drive resistance to standard therapies, preventing dead-end research directions before they consume resources.

    When a pipeline lacks an integrated interpretation layer, sequencing data remains an expensive, uninterpretable output. Researchers end up spending hours manually cross-referencing literature that the platform should have surfaced automatically.

    How GenomeBeans Structures the Tumor Somatic Exome Report

    GenomeBeans was built to solve this interpretation gap. The automated bioinformatics platform manages the entire pipeline, from raw FASTQ files to clinical tiering, and produces a structured Tumor Somatic Exome report designed for immediate clinical and research use.

    Findings are prioritized using a clinically aligned hierarchical structure based on AMP/ASCO/CAP guidelines:

    TIER I: Actionable Targets

    Variants with strong, direct therapeutic associations and established clinical evidence.

    TIER II: Emerging Clinical Relevance

    Active trial matches, investigational targets, and relevant sub-clonal markers with accumulating evidence.

    TIER III: Variants of Unknown Significance

    VUS requiring further functional validation before clinical application.

    TIER IV: Benign and Likely Benign

    Variants deprioritized based on population frequency and functional evidence.

    The cloud platform automates alignment, quality control, and variant calling using standardized, reproducible pipelines with full version control. The final report surfaces verified somatic mutations alongside their therapeutic implications, structured for review, not for further processing. The emphasis is on reproducibility and auditability across research and clinical workflows.

    Review a Structured, Actionable Layout

    Click below to download a production-grade sample report and see how GenomeBeans organizes complex variant data into clear, interpretable findings:

    Download Sample Tumor Exome Report

    Stop spending research hours formatting spreadsheets and manually cross-referencing public databases. Upload your raw sequencing files to GenomeBeans, run your somatic exome pipelines automatically, and get structured biological insights your team can act on within hours.

  • Oncology Labs Are Missing Actionable Tumor Mutations. Somatic Variant Calling Is the Gap No One Is Talking About

    Oncology Labs Are Missing Actionable Tumor Mutations. Somatic Variant Calling Is the Gap No One Is Talking About

    Tumor sequencing has never been more accessible. Sequencing costs have dropped, throughput has increased, and most oncology labs can generate millions of reads from a single experiment. Yet clinically relevant mutations are still being missed not because of sequencing failure, but because detecting low-frequency somatic variants is a fundamentally different problem from generating high-quality data.

    The gap between raw sequencing reads and actionable results lives in the analysis. Specifically, in whether a variant calling pipeline is built to handle the biological complexity of tumors rather than the cleaner statistical patterns typically seen in germline sequencing.

    The Analytical Hurdle of Detecting Somatic Mutations in Cancer

    Somatic variants in cancer do not behave like inherited germline variants. In germline genetics, heterozygous variants typically appear near 50% allele frequency, while homozygous variants approach 100%. Tumor biology is far less predictable.

    A driver mutation present in a subclone may appear at 5% variant allele frequency (VAF) or even lower. Healthy stromal tissue, infiltrating immune cells, variable tumor purity, and clonal heterogeneity all dilute the signal. In a heterogeneous tumor sample, the mutation that matters most an emerging resistance mutation or a rare subclonal driver may be represented by only a small fraction of sequencing reads.

    At these frequencies, distinguishing a genuine variant from PCR artifacts, mapping errors, sequencing noise, or strand bias becomes significantly more challenging. Variant callers designed primarily for germline analysis are not optimized for this problem. Applying them directly to tumor data can increase false negatives at precisely the variants that carry the greatest biological and clinical significance.

    To recover these signals reliably, variant calling workflows must use statistical models capable of separating true low-frequency mutations from background technical noise while maintaining confidence in the final call set.

    Sensitivity Alone Isn’t the Answer

    The natural response to missing variants is often to lower filtering thresholds and retain more calls. However, permissive filtering introduces a different challenge: false positives that increase review burden, complicate interpretation, and reduce confidence in downstream analyses.

    Modern somatic callers such as Mutect2 and Strelka2 address this problem through likelihood-based models that evaluate multiple signals simultaneously, including read depth, base quality, mapping quality, strand orientation, and allele frequency. Rather than relying on a single threshold, these tools assess the probability that a variant represents a true biological event.

    Matched tumor-normal analysis adds another layer of confidence by using the normal sample as a reference to distinguish inherited germline variants from tumor-specific mutations. Clinical samples also present additional challenges, including FFPE-associated artifacts and oxidative damage signatures that require dedicated handling strategies beyond those available in generic analysis pipelines.

    Achieving both sensitivity and specificity requires a workflow designed specifically for tumor biology rather than one adapted from a different analytical context.

    Reproducibility Is a Clinical Concern, Not Just a Computational One

    A variant call that appears in one analysis run but not another is difficult to trust. In oncology, inconsistency affects far more than computational workflows. It influences which mutations are reported, which patients may qualify for clinical trials, and which biomarkers progress through validation studies.

    Many reproducibility issues in somatic variant calling originate from the same underlying factors: inconsistent software versions, changing reference genome builds, variable filtering parameters, and differences in execution environments. As studies scale across larger cohorts, these inconsistencies can compound and create the appearance of biological variation where analytical variation may be contributing to the observed differences.

    Standardized workflows help reduce this risk. Locked software environments, documented filtering strategies, version-controlled reference resources, and consistent annotation against databases such as COSMIC and ClinVar improve confidence that results can be reproduced across projects, operators, and time.

    What a Production-Ready Somatic Calling Workflow Actually Requires

    Not every pipeline marketed for cancer genomics is built to support the demands of translational research and biomarker discovery. Evaluating a somatic variant calling workflow requires looking beyond processing speed or automation claims.

    The most important questions are practical:

    • Can the workflow reliably detect variants below 5% VAF without substantially increasing false-positive rates?
    • Does it support matched tumor-normal analysis or operate without a germline reference?
    • How are FFPE artifacts, duplicate reads, and mapping challenges in repetitive genomic regions handled?
    • Are software versions, reference genomes, and annotation resources standardized and controlled?
    • Does variant annotation integrate with clinically and biologically relevant resources such as COSMIC and ClinVar?

    These are not advanced or optional considerations. They represent the baseline requirements for generating variant calls that can support downstream biological interpretation with confidence.

    The Real Cost of Getting This Wrong

    Missed low-frequency variants are not a theoretical concern. Subclonal resistance mutations, early clonal evolution signals, and rare driver events in heterogeneous tumors can all remain hidden when analysis workflows are not optimized for low-VAF detection.

    In many cases, the sequencing data already contains the answer. Whether that answer is recovered depends largely on the design and rigor of the analysis pipeline.

    At GenomeBeans, our cloud-based NGS workflows are built around this challenge specifically. From raw FASTQ files through annotated variant reports, somatic variant calling workflows are standardized to improve reproducibility while maintaining sensitivity to clinically relevant signals. The objective is not to replace scientific judgment, but to ensure that the variants most deserving of scrutiny are consistently identified and made available for interpretation.

    See How Easy It Is to Review Your Data

    GenomeBeans provides a cloud-based platform for standardized somatic variant analysis, helping researchers move from raw sequencing data to annotated results through reproducible workflows.

    Explore a sample analysis output to see how variant calls, annotations, and quality metrics are presented:

    View Sample Analysis Report

    Whether you’re evaluating low-frequency variants, reviewing tumor-normal comparisons, or assessing biomarker candidates, having a consistent analysis framework can make interpretation more efficient and reproducible.

  • Demystifying Immunomics: A Researcher’s Guide to TCR and BCR Repertoire Profiling

    Demystifying Immunomics: A Researcher’s Guide to TCR and BCR Repertoire Profiling

    A researcher dedicates months to carefully design experiments to probe immune responses. Now, terabytes of raw sequencing data are waiting to be analyzed. The goal of identifying specific phenotypes or tracking immune cell dynamics is challenging, and the computational analysis required to extract these insights can feel tricky.

    This is where our immunomics analysis comes into play. It transforms raw data into actionable biological understanding without demanding specialized coding skills. The following guide breaks down the core concepts of immune repertoire profiling, focusing on T-cell receptors (TCRs) and B-cell receptors (BCRs).

    What is Immunomics?

    Immunomics is the study of the immunome, encompassing the genes, proteins, and molecular interactions that define the immune system’s functional states. Instead of analyzing isolated immune markers, it provides a holistic view of entire immune cell populations and their functional states.

    At its core, an Immunomics pipeline characterizes the immune repertoire, i.e., the full diversity of TCRs and BCRs. The adaptive immune system relies on this diversity to recognize pathogens; profiling it offers a molecular snapshot of an individual’s immune history, vaccine efficacy, and disease progression.

    TCR vs. BCR Repertoire: Structural Differences

    TCRs and BCRs enable highly specific antigen recognition and they have distinct architectures and mechanisms:

    • T-Cell Receptors (TCRs): Typically membrane-bound heterodimers composed of an alpha ($\alpha$) and a beta ($\beta$) chain. Most TCRs recognize processed peptide antigens presented by MHC molecules on antigen-presenting cells, though subsets such as $\gamma\delta$ T cells and NKT cells can recognize antigens independently of classical MHC presentation.
    • B-Cell Receptors (BCRs): Membrane-bound antibodies shaped like a “Y”, comprising two identical heavy chains and two identical light chains. BCRs directly recognize both conformational and linear epitopes on intact antigens without needing MHC presentation.

    How Immune Repertoire Diversity is Generated

    The astronomical diversity of TCRs and BCRs is driven by V(D)J recombination. This genetic mechanism randomly rearranges distinct segments to assemble a functional receptor:

    • V (Variable) Segment: Codes for the initial part of the antigen-binding site.
    • D (Diversity) Segment: Found in heavy chains and TCR beta/delta chains, contributing additional sequence diversity at the nucleotide level during recombination.
    • J (Joining) Segment: Links the variable domains to the constant region.
    • Junctional Diversity: Random N-nucleotide additions inserted directly between these segments during the recombination process.

    During this process, random nucleotide additions occur at the junctions to create junctional diversity. The most hypervariable region arising from this junction is the Complementarity Determining Region 3 (CDR3). Because the CDR3 loop directly dictates antigen specificity, sequencing this region is the cornerstone of immune repertoire analysis.

    Strategic Applications in Biomedical Research

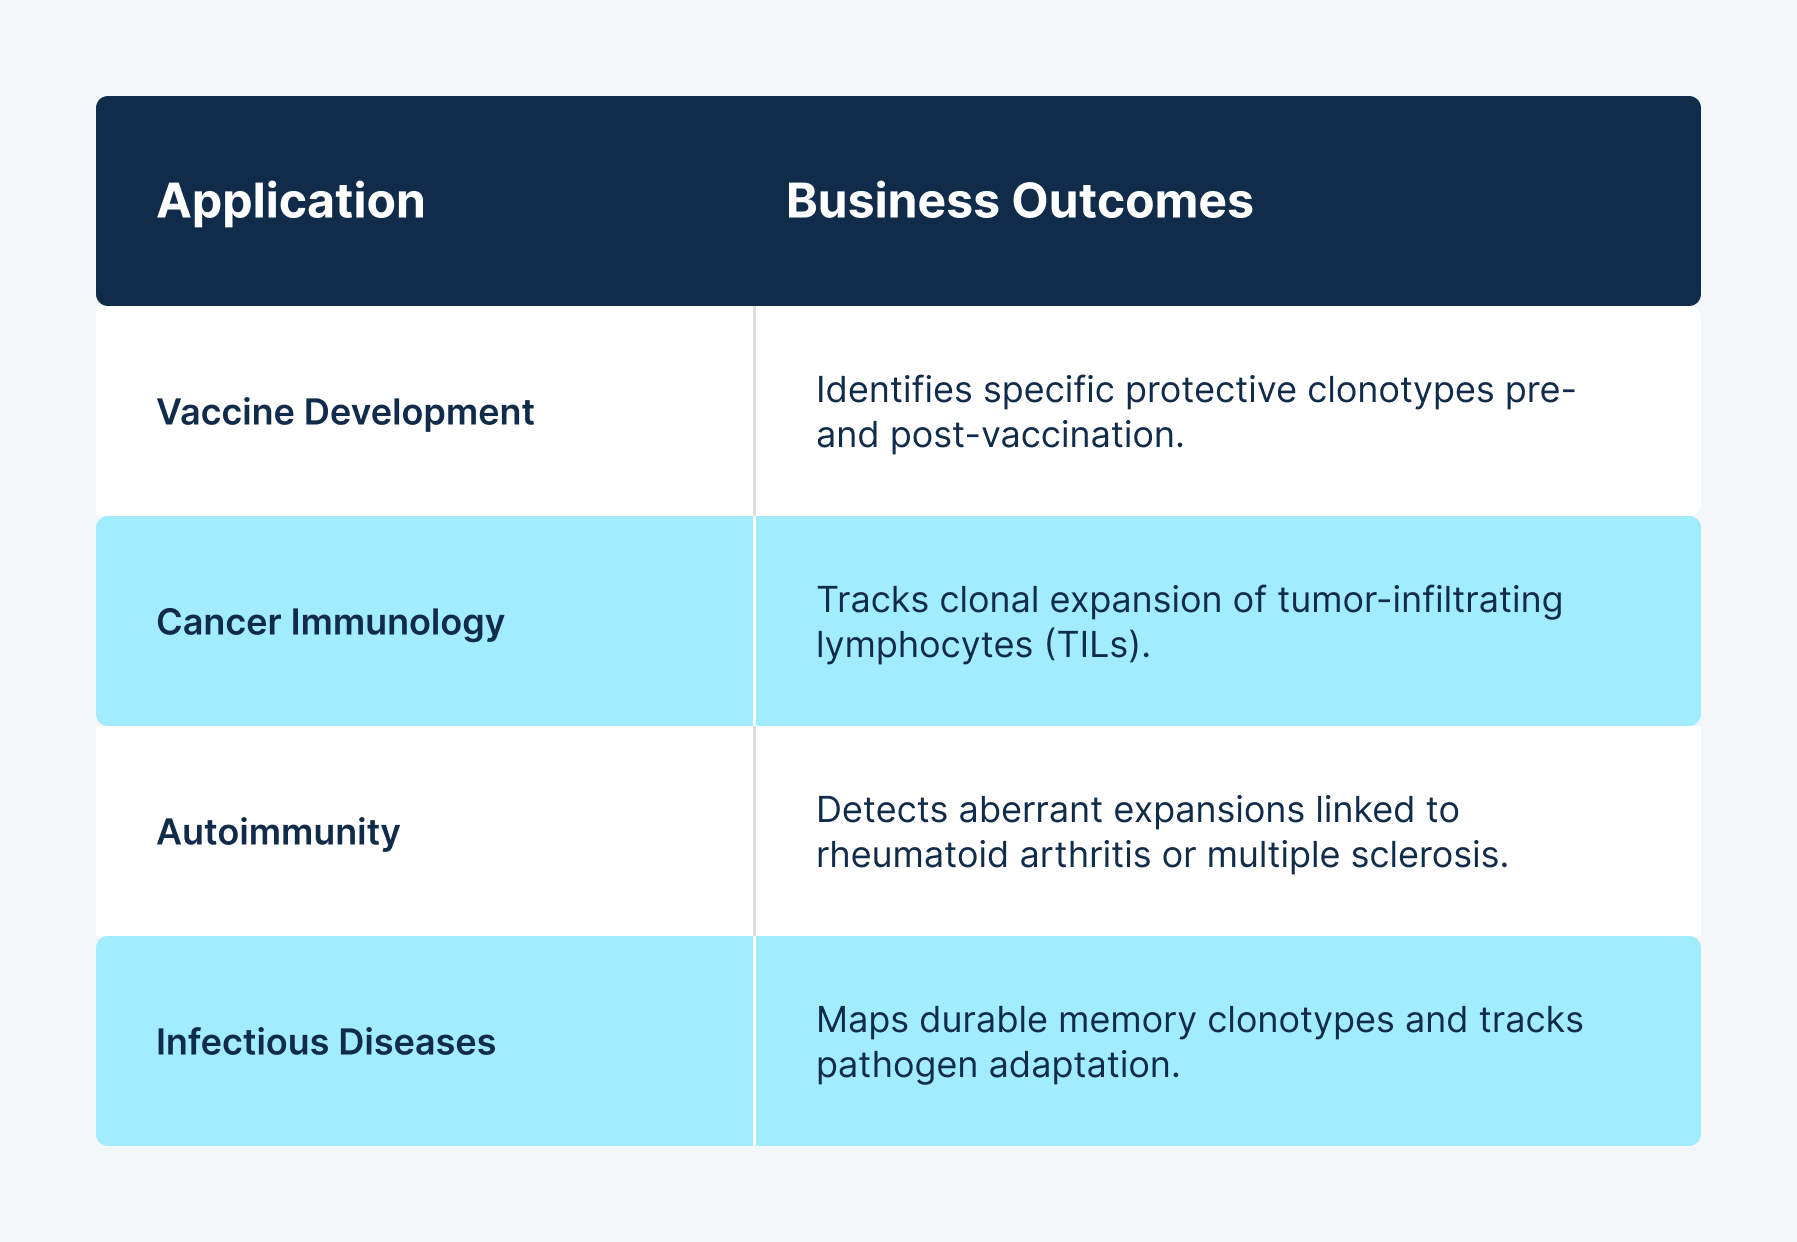
    High-throughput NGS sequences millions of individual receptor reads, which following computational processing, enables mapping of clone frequencies across several critical fields:
    A table mapping biotechnology applications to business outcomes, including Vaccine Development, Cancer Immunology, Autoimmunity, and Infectious Diseases.

    Key Metrics in Bioinformatic Interpretation

    Accurately interpreting immunomics data requires monitoring five primary metrics:

    1. Diversity Indices: Metrics like Shannon entropy or the Simpson index quantify the overall diversity of the repertoire by accounting for both the number of unique clonotypes and their relative abundances.
    2. Clonal Expansion: Tracks the frequency of specific clonotypes reacting to an antigenic stimulus.
    3. Public Clonotypes: Identifies shared TCR or BCR sequences across different individuals to find conserved immune responses.
    4. V(D)J Gene Usage: Evaluates biases or preferences in gene segment selection during recombination.
    5. Data Normalization: Adjusts for variations in sequencing depth to allow accurate sample-to-sample comparisons.

    Accelerate Your Immunomics Research

    Processing millions of sequencing reads frequently creates a bioinformatic bottleneck. If you are spending more time troubleshooting command-line scripts than interpreting biological findings, you might ask: is bioinformatics just about coding? Fortunately, automated pipelines offer a scalable alternative.

    Standardized cloud platforms handle the computational heavy lifting, yielding publication-ready reports while letting you focus entirely on the science.

    Transform Your Raw Sequencing Data Into Discovery

    Don’t let complex bioinformatic pipelines stall your research momentum. Upload your raw NGS data to GenomeBeans and receive fully analyzed, publication-ready immunomics reports in hours, with zero coding required.

    Ready to accelerate your immune profiling?

    Contact our team to discuss your project, request a demo, or submit your first dataset for automated analysis today.